Up to 200,000 tonnes per year of harvesting residues will be transported by road from State Forests within the South Coast region to the charcoal plant near Mogo. And up to 35,000 tonnes per year of charcoal will be transported by road, or road/rail, from the charcoal plant to the proposed silicon smelter near Lithgow (1).
Log trucks will each carry 25-28 tonnes depending on the truck type, tree species, etc. The company hopes to get more on a charcoal truck but bulk and light weight will probably limit this. They may use containers. They will transport charcoal up Kings Highway probably to Queanbeyan and use rail to Lithgow. About a third of the log trucks will use some part of Kings Highway.
State Forests claim that there will be about 70 truck movements per day at the plant site, during the day. About 15% of these will be associated with trucking charcoal from the plant to Lithgow via the Kings Highway, the rest will be trucking logs to the plant from wherever logging is taking place. Trucks will only operate during daylight hours. It is estimated that there will be one truck entering or leaving the plant EVERY 8.5MINUTES (2)
The Charcoalition’s transport group has checked the figures supplied by State Forests, and discovered that:
- the figures omit trucks carrying sawdust and sludge from the plant, gas deliveries and staff movements – for sawdust trucks alone, it is estimated that there would be another 8000 truck monements per year at the plant;
- existing heavy vehicle figures quoted by State Forests are overstated, therefore the figures giving % increase of heavy vehicle traffic are blatantly understated, perhaps by as much as 60%. This matter is being raised at a Parliamentary level.
The Charcoalition has been proved to be correct.
On p81 of planning NSW’s Report on the Assessment of Development Application No. 317-11-2001-i Pursuant to Section 80 of the Environmental Planning and Assessment Act, 1979:
“The Environmental Impact Statement establishes existing traffic volumes on roads to be utilised for the proposed development from traffic counts undertaken by the RTA and presented in Traffic Volume Data for Southern Region 2000 (NSW RTA, 2001). This data has been applied by the Applicant as the Annual Average Daily Traffic (AADT) along a particular route with the additional vehicle movements then added to establish a “future scenario”. In apply this existing information, the Applicant has misinterpreted the exact nature of the data. The traffic counts along the roads considered by the Applicant in the EIS are based on axle pair movements. That is, a normal passenger car with one axle pair is taken as one AADT, while heavy vehicles, such as those considered in the EIS, have three axle pairs and represent 3 AADT for every vehicle movement (one-way). In simple terms, the Applicant has added vehicle movements to axle pair movements and calculated a predicted increase in vehicle movements based on incompatible data (axle pairs versus vehicles). The results of these calculates have, in essence, assumed that heavy vehicles only have a single axle pair, similar to a passenger vehicle.”
The Charcoalition alerted people to these incorrect statistics on current heavy vehicle numbers way back in October 2001 before the EIS came out. We were laughed at and ridiculed. But it turns out that WE WERE CORRECT, and that figures quoted in a poster by State Forests, and the company’s booklet and EIS were incorrect and grossly misleading – leading to a gross underestimate of the expected increase in heavy vehicle traffic.
The following estimates are extracts from a brochure by State Forests about transport associated with the charcoal plant in the area of the charcoal plant and the Kings Highway. Note that there are a different set of figures in the latest booklet put out by the company.
| Additional heavy Vehicles per day | % Increase in heavy vehicles | |
| Kings Highway | ||
| Nelligen | ||
| Mogo | ||
| Batemans Bay | ||
| Charcoal plant | ||
| Moruya |
The above figures are based on maximum production volumes and do not take account of back-loading opportunities
* The Charcoalition have evidence which proves that these figures are blatantly understatedNote: the brochure says that trucks will not operate on Sundays or public holidays, then quotes the above “average annual daily” figures. If these figures are based on a 7 day week, and trucks are not operating on Sundays and public holidays, then the average number over a 6 day week would be higher. For example, at the plant site, there would be at least 86 additional movements per day, or one truck every 7 minutes (based on a 10 hour working day.
These trucks will enter and exit the plant just north of the Broulee turn-off (an acknowledged blind spot on the Princes Highway). Mogo, Moruya and Batemans Bay, and Canberra users will see a significant increase in the number of trucks on the road.
- If you have a 30 minute coffee & cake at Mogo during the day, two trucks associated with the plant will pass you by. (2)
- The children and staff at little Mogo school, situated right on the highway will have the noise and fumes of 24 additional trucks passing by every day; one every 15 minutes. (3)
- On your way from Canberra to the South Coast via the King’s Highway, stop and have a break. You are likely to see one truck associated with the charcoal plant pass by every 22 minutes. (2)

An issue of concern here is that there will be additional maintenance required on roads in the area. Who will pay for that? What will the effects be on the Princes Highway?
References:
(1) State Forests brochures and company statements.
(2) State Forests brochure The Lithgow Silicon Project, Transport, South Coast, and assuming a 10 hour working day.
(3) (2) plus assuming a 6 hour school day.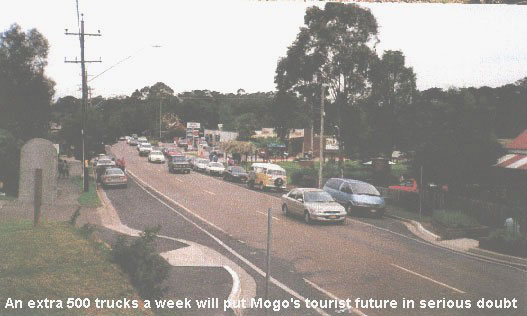
Investigations by the Charcoalition’s Transport Study Group have shown that figures on the State Governments’ glossy poster released by State Forests called ‘The Lithgow Silicon Smelter Project – Transport – South Coast’ may be incorrect and misleading. Click here to see the press release.
In the latest information booklet produced by the company, estimates of these heavy vehicle transport associated with the plan have been changed, and, significanlty, they have removed the estimate of heavy vehicle activity at the plant site – the busiest heavy vehicle location. They have also included trucks carrying sawdust and fluxwood, also staff and maintenance vehicles – none of which were included in the State Forests figures.
This booklet also states that “the region has well developed roads and highways” Do you think that is true?
Will the Kings Highway be safe with all these extra trucks?
The NRMA has released a paper called NRMA “Kings Highway” Road Safety Audit Report, A review of the road safety performance and influential factors along Main Road 51 (the “Kings Highway”) July 2001.
This paper includes the following statements:
“However, despite overall improvements, the crash and casualty rates along the route continue to be higher much higher than those experienced on other main routes in the region recently surveyed by NRMA. The winding alignment of the route with a range of high and low speed curves may be a contributing factor, also impacting on the efficiency of the “highway.” This winding alignment, and overtaking restrictions can produce frustrating conditions for motorists, particularly during seasonal peak times when traffic volumes can more than triple.
“The descent of the Clyde Mountain also continues to remain treacherous to motorists. Black sections identified in previous reports now appear to exhibit poorer road safety performance than they have historically. A possible explanation may be the poorer relative conditions as the remainder of the route improves combined with greater demands on the route. This particular section may necessitate increasing road safety scrutiny over time.”
These are worrying statements about safety on the highway, which could decline if there was a significant increase in heavy vehicles.
The transport impacts in the EIS should be looked at to see that safety aspects are adequately addressed.